
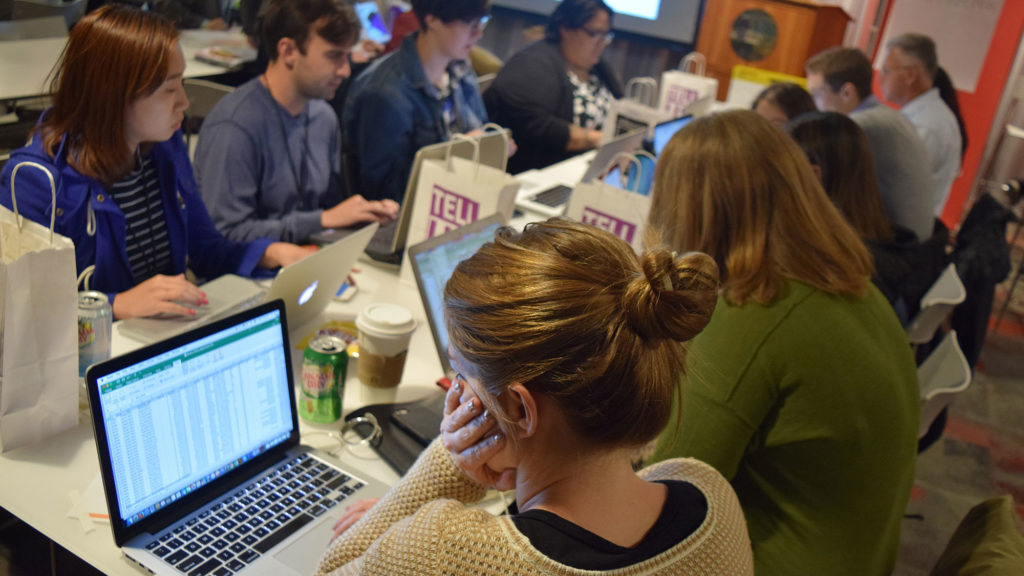
In the mezzanine of Northeastern University’s Curry Student Center, young people hunched over their computers and clacked away at their keyboards. Spreadsheets were strewn around them and lines of computer code filled their screens. Gathered for the university’s inaugural hackathon – part of HUBweek, a weeklong event focused on innovation – these aspiring data scientists and journalists fused their skill sets together. It’s what John Wihbey, an assistant professor of journalism and new media at Northeastern, says could become the “future” of storytelling.
“One of the goals here is to have these students build relationships with one another and exchange e-mails, laying down the foundation for future innovation,” he said.
Every journalist hopes that their work can make big changes in the world, and data is one of the most obvious methods for backing up a story.
“Data is a tool of disruption,” said Igor Tolchinsky, CEO of WorldQuant, an investment firm known for discovering trends in financial markets by using algorithms that indicate a good time to sell stocks.
At the Hackathon, young adults were given data on stop and frisk incidents, homicides and Boston demographics. Their challenge: find an innovative way to present data on issues related to criminal justice.
“We want the students to come up with interesting questions about crime in Boston, analyze it and visualize it so that people can continue to think about it,” Wihbey said.
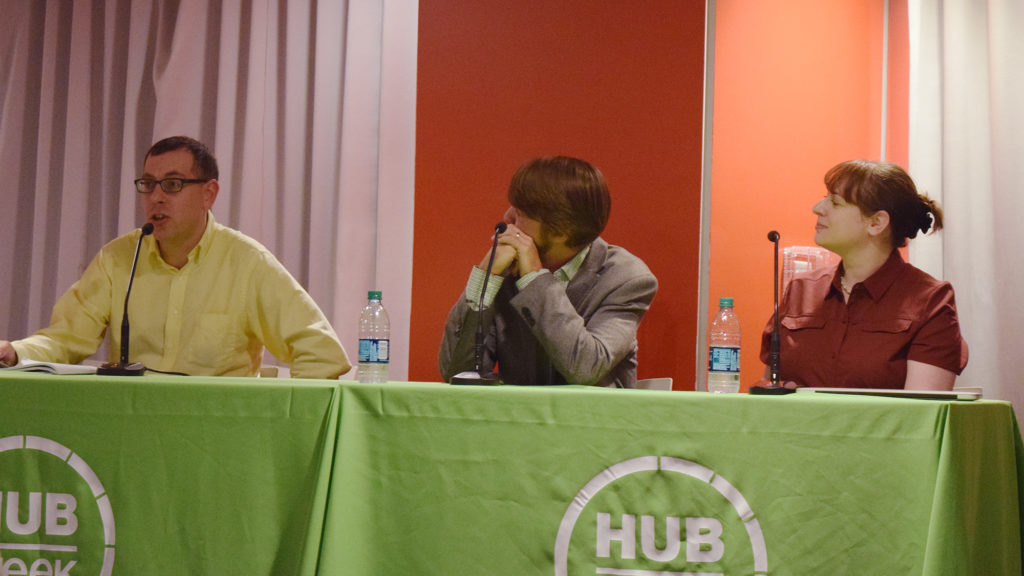
Different approaches
For journalists, a Hackathon is not infiltrating servers and stealing private information. It’s actually a chance for people from different disciplines to come together and innovate stories using computer software, and to translate data into stories that are consumable by the public it concerns.
A group of graduate journalism students sat down and sifted through lines of excel. Applying a journalistic lens, they wanted to know if the data shows a relationship relevant to the ongoing protests against police brutality and accusations of profiling in the U.S.
“We decided to see if we can find a correlation between stop and frisk and the clothing people wore,” Giuila Afiune said.
They found that 17 percent of stop and frisk incidents involved a person wearing a hooded sweatshirt, a politically-affiliated piece of clothing or something similar. They initially wanted to create a calculator that determined the probability of being stopped and frisked based on the clothes the person is wearing.
Some even wrote their own programs, which could do more heavy lifting. During one of the presentations, a first year computer science student, Jack Michaud, said that he wrote a program that could look for correlations between monthly crime rates stop and frisk incidents. He found that crime and stop and frisk both peaked in May.
The probable cause, according to his research?
The Bruins elimination from the playoffs.
A symbiotic relationship
The relationship between Journalism and data is not new – it dates back to the 1970s, according to Todd Wallack, an award-winning reporter for Boston Globe’s Spotlight team.
“Back then, it was known as ‘computer assisted reporting’ because journalist were still using typewriters and dummy terminals attached to a mainframe,” Wallack said.
Journalists are the ones who are used to campaigning for data, especially data on national security and criminal justice, which are the hardest to acquire, Wallack said. After 9/11, public record laws were amended on the grounds of safety, making records harder to get.
“We do what we can to achieve the data, analyze it ourselves and work with data scientists to analyze it,” Wallack said.
And in order to secure this information from public agencies, organizations like The Boston Globe report on the records request process to put pressure on the government agency. Sometimes, the fee to obtain records is low, but other times, it’s prohibitively expensive – state police once tried to charge $2.7 million for access to data surrounding breathalyzer tests, according to Wallack. The last resort is to ultimately sue the agency for the data, citing public records laws.
“A data scientist is not going to sue the government for the information,” he said.
Journalists bring value because data scientists don’t always have the storytelling skills necessary to make their findings accessible. In fact, sometimes they miss details that make for a greater story, Wallack said, using public employee salary averages as an example.
“If a data scientist sees an outlier, they likely ignore it because it will ruin the average, but to a journalist it makes us ask, ‘Why? Why is that person making more money than the average?’”
And in order to effect change with data, it’s important to have a human face fronting numbers – and journalists are often the ones who are best at finding the human story. Borkin, an astrophysicist and data visualization specialist studying medical data, said that the numbers she works with are essentially people.
“Every single line of data is a patient and that is someone’s life,” she said.
Yet most journalists cannot run such sophisticated operations without the help of data scientists, who often know how to run R, Python and other statistical analysis programs out there used to parse through and interpret massive amounts of data.
29-year-old Ben Towne, the hackathon’s winner, analyzed the stop and frisk data and found these tactics were used more frequently by some officers. He also found that groups of police officers that share the same supervisor, stop and frisk more frequently. But he also pointed out that the data needed context, since one of those groups was a gang unit, meaning that it might be part of their job to stop and frisk.
“Journalists should be teaching data scientists storytelling skills, and data scientists should be teaching journalist data analyzing skills,” he said.
Correction: This article was updated to reflect more accurate findings from the data used at the Hackathon. The data shows that some groups of police officers with higher rates of stop and frisk incidents shared the same supervisor.


